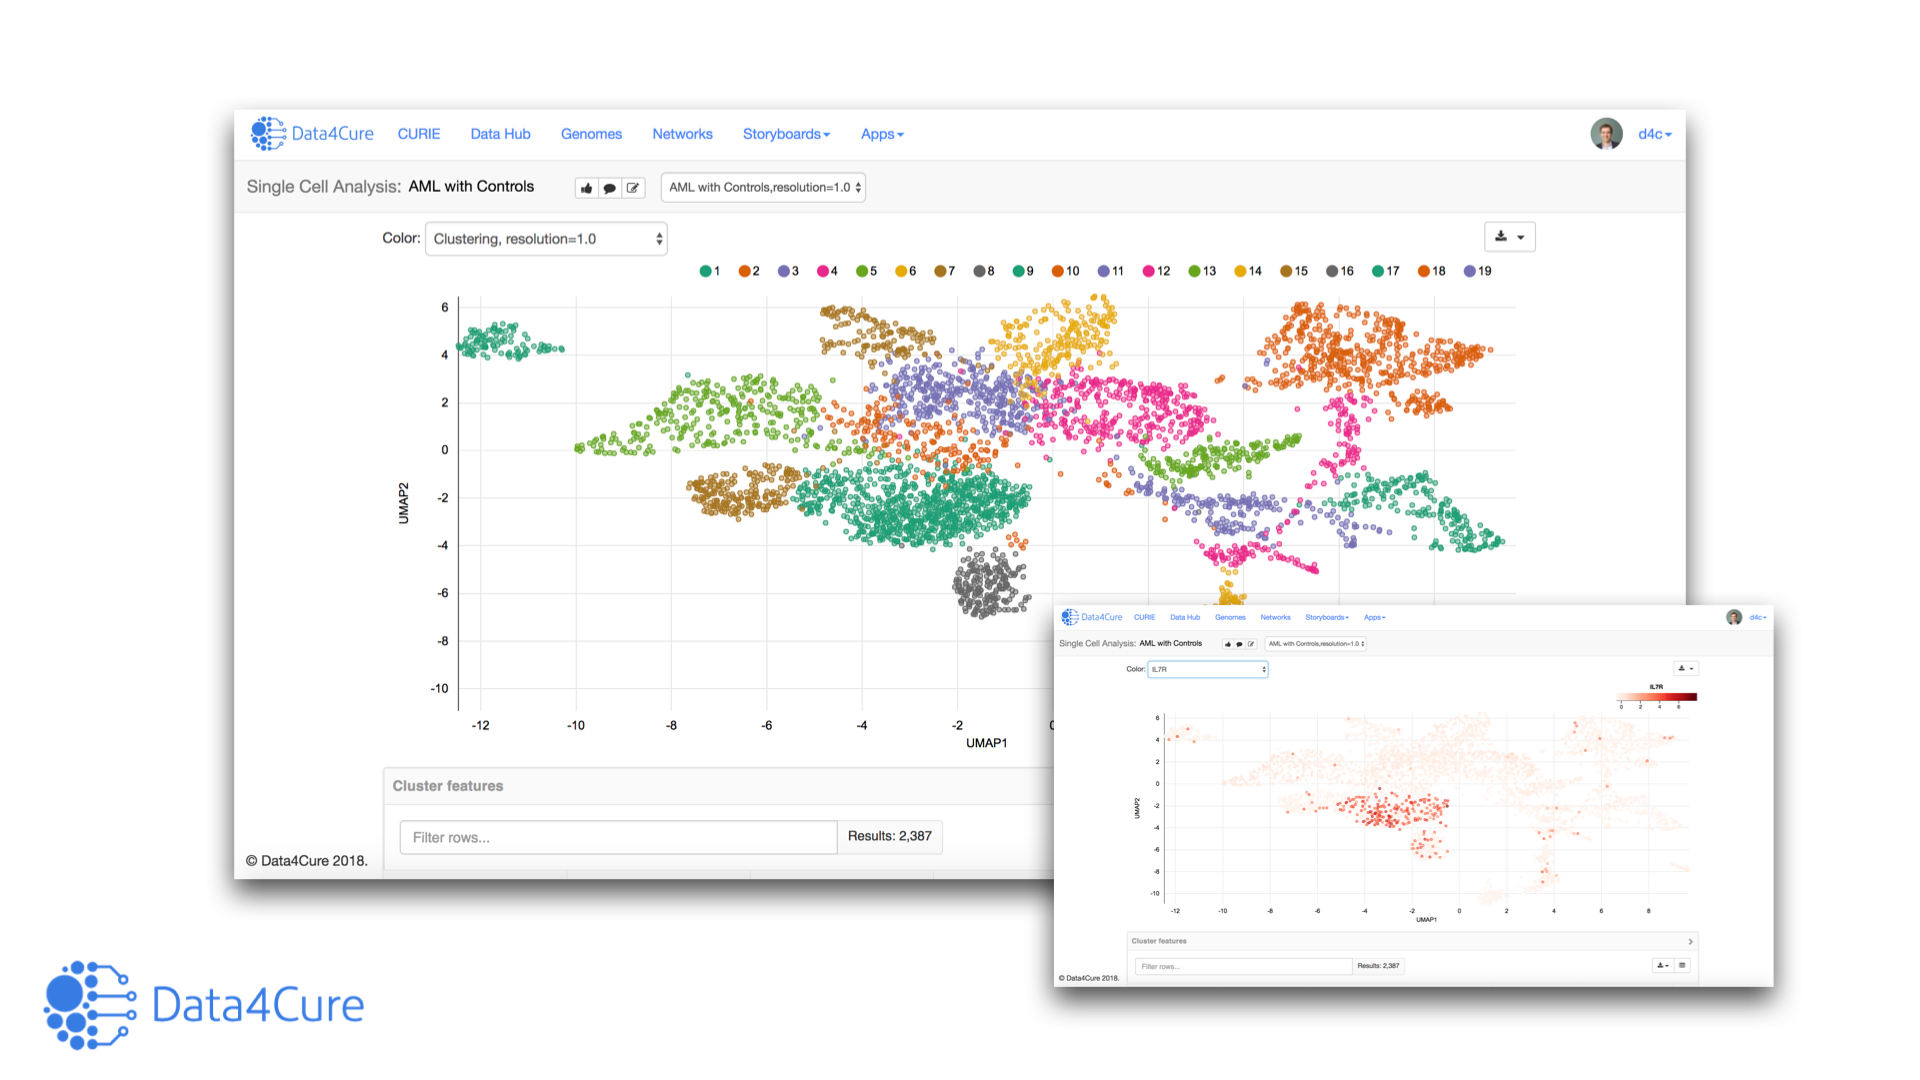
Single cell analysis of immunotherapy resistance pathways in the context of the CURIE Knowledge Graph

Greetings! This week in our technology section of the blog we are covering the Data4Cure Single-cell RNA-seq Analysis App – part of the Biomedical Intelligence Cloud App Engine. We will focus on analysis of two recently published single-cell datasets looking at identifying biomarkers for immunotherapy response/resistance: Jerby-Arnon et al., Cell, 2018 and Sade-Feldman et al., Cell, 2018.
Beyond covering the standard set of pipelines for single cell RNA-seq analysis, we will show you how the results of the Single-cell RNA-seq Analysis App plug into the CURIE Knowledge Graph and other apps on the platform to enable instantaneous enrichment and contextual interpretation of the results in context of prior data.
In terms of the standard pipelines, the single cell RNA-seq analysis app covers:
- Pre-filtering cells & genes
- Identifying highly variable genes
- Regressing out covariates
- Dimension reduction
- Louvain clustering
- Visualization based on t-SNE or UMAP
- Identifying marker genes, pathways and cell-type signature enriched among clusters
Resistance signatures associated with T cell exclusion and immune evasion
Let’s jump right into the first case study. Applying the Single Cell Analysis App to the Jerby-Arnon et al. data identifies distinct clusters of malignant melanoma cells

The Pathway Expression app shows that antigen processing, interferon gamma signaling, and other immune pathways are downregulated in malignant single cells from tumors resistant to anti-PD1 therapy as described in Jerby-Arnon et al.

The CURIE Knowledge Graph shows that the Jerby et al. CD8 cytotoxic T cell exclusion signature is downregulated in responders to anti-PD1 therapy in a dataset published by Riaz et al., Cell 2017 – a different study which has also been analyzed on the platform.

And that a set of marker genes upregulated in CD8 cytotoxic T cells from Jerby-Arnon et al. is upregulated in responders to anti-PD1 in Riaz et al as well as in data from Cejalvo et al., Cancer Research 2017 – another anti-PD1 therapy study which has been integrated and analyzed on the platform.

T Cell States Associated with Response to ICI
For our second case study we looked to the data published by Sade-Feldman et al. The Single Cell Cluster Analysis app identifies CD8 T cells among single cells from melanomas treated with pembrolizumab.

The Single Cell Cluster Analysis app identifies a population of T cells associated with memory, activation, and cell survival and a population associated with cell exhaustion as in Sade-Feldman et al.

Comparing the activated versus the exhausted T cell populations using the Pathway Expression app identified increased TCF7 and IL7R expression in activated CD8 T cells and among responders to pembrolizumab.

The Multidimensional Cohort Analysis app shows that increased TCF7 and IL7R expression is also associated with response in Cejalvo et al., 2018.
Together, these results demonstrate the utility of the Single-cell RNA-seq Analysis App in providing in depth analysis of single cell data and the power of the Knowledge Graph to contextualize the results and connect them to other studies on the platform.
Now let’s turn data into cures.
Interested in discussing these or other case studies using the Data4Cure platform? We’d love to hear from you. Write to us at info@data4cure.com. Let us know how we can help and let’s turn data into cures!
— The Data4Cure Team.
References
Riaz et al. Tumor and Microenvironment Evolution during Immunotherapy with Nivolumab. Cell 2017.