Empowering Parkinson's disease insights using the Biomedical Intelligence Cloud
- Biomarker discovery in Parkinson's disease (PD) is challenging due to late-stage symptom emergence and limited access to high-quality datasets.
- The Biomedical Intelligence Cloud offers access to curated datasets, aiding in biomarker identification and drug target discovery for PD.
- The Parkinson's disease resource collection in the Biomedical Intelligence DataHub provides an integrated collection of human and mouse datasets for gene expression analysis across different tissues, cell line models, and patient populations.
- Advanced data and pathway analysis tools enable researchers to interrogate, visualize and better understand the biological mechanisms underlying PD.
- Curated single-cell datasets enable higher-resolution exploration of Parkinson's pathology and identification of therapeutic targets.
Parkinson's disease (PD) presents a challenge to researchers, particularly in the domain of biomarker discovery. Current diagnostic methods predominantly rely on observable clinical symptoms, which tend to emerge only in the later stages of the disease. This delay significantly impedes early intervention efforts and compromises the efficacy of available treatments. Early disease biomarkers are therefore invaluable. However, the search for dependable biomarkers for PD has been challenging, mainly due to the complex nature of disease pathology and the limited availability of comprehensive datasets for analysis.
The vast array of published 'omics studies on human diseases and animal models presents a unique opportunity for biomarker and drug target discovery, yet it also poses challenges in extracting meaningful molecular signatures due to factors such as small sample sizes and disease heterogeneity. The Data4Cure Biomedical Intelligence Cloud offers a solution by providing access to a comprehensive collection of thousands of curated 'omics datasets across all major disease areas, facilitating faster and more effective biomarker and drug target identification.
In this blog post we zoom into a rapidly growing Parkinson's disease resource collection which emerges as a powerful solution for biomarker discovery in Parkinson’s disease. Comprising 66 pre-analyzed bulk and 11 single-cell RNAseq datasets, this collection offers a wealth of gene expression data spanning 3,334 samples and 1,056,893 cells, derived from various tissues, cell line models and patient populations. Using the Parkinson's disease resource collection you can examine over 168 analyses from studies comparing Parkinson’s disease cases and control samples obtained for human cortex, putamen, substantia nigra, dopaminergic neurons and other tissues and cell types.
Exploring gene expression patterns in Parkinson's disease
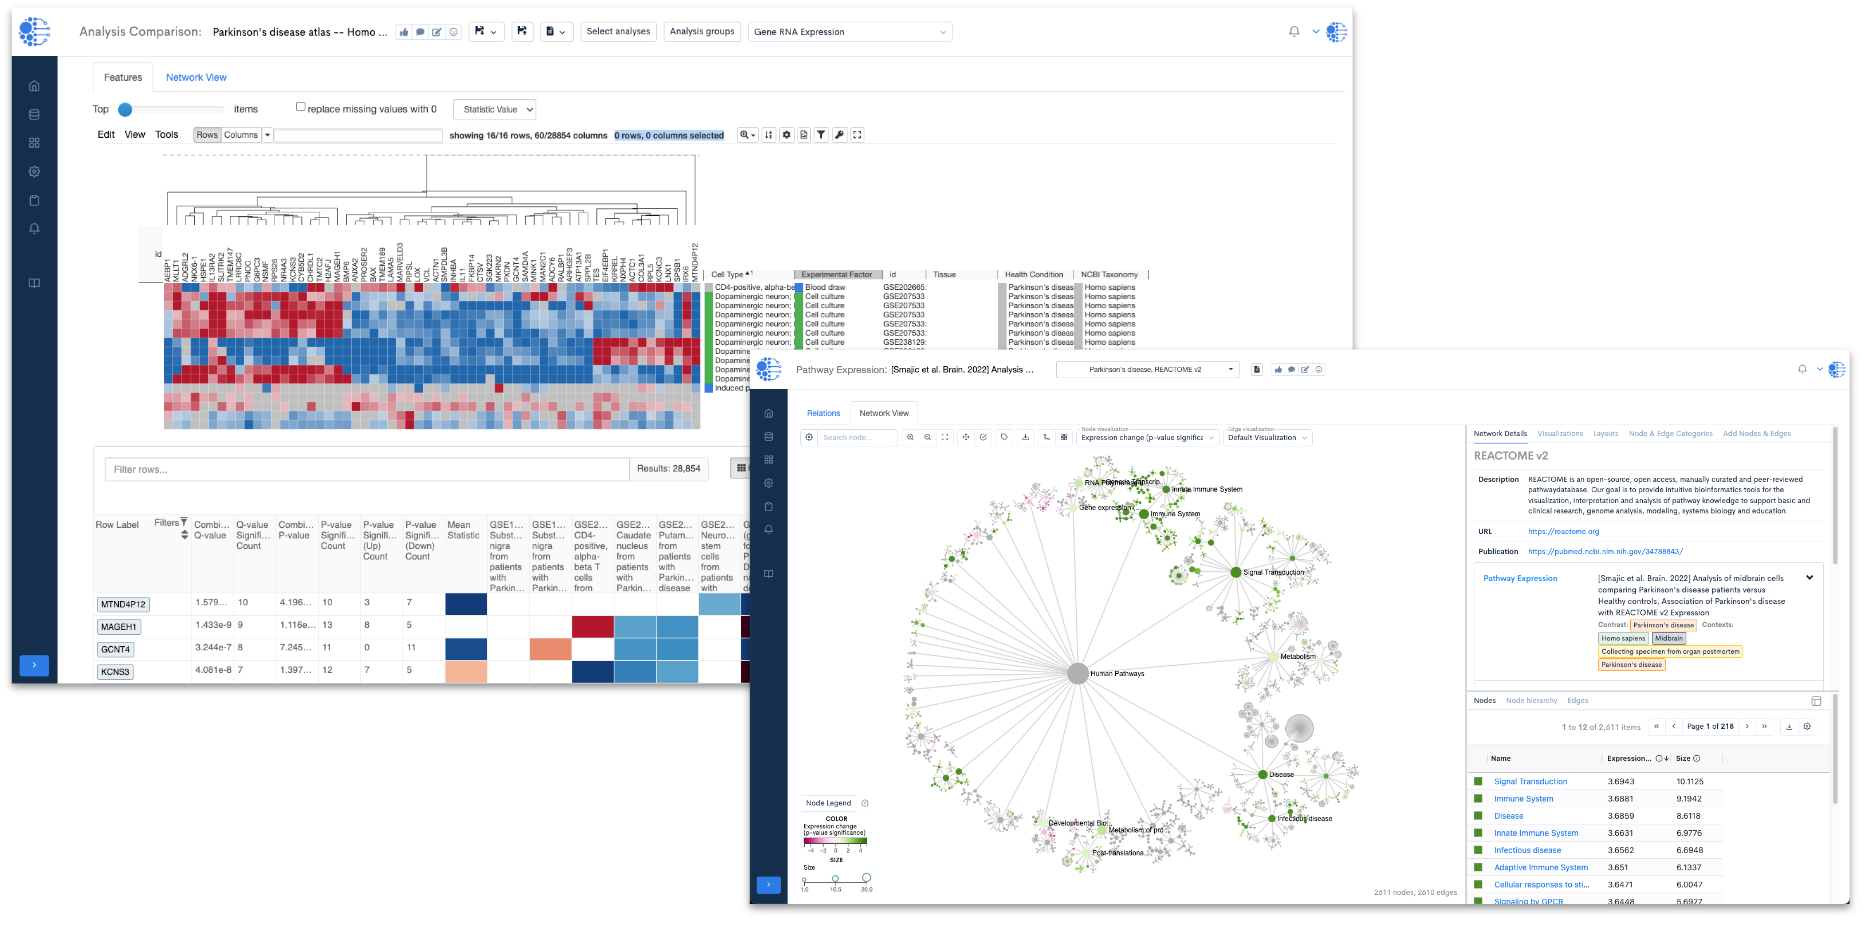
One of the primary utilities of this resource lies in its ability to delve into variations in gene expression across different cell lines derived from individuals affected by Parkinson's disease (Figure 1). By examining these variations, researchers can pinpoint significant genes associated with the pathology of the disease.
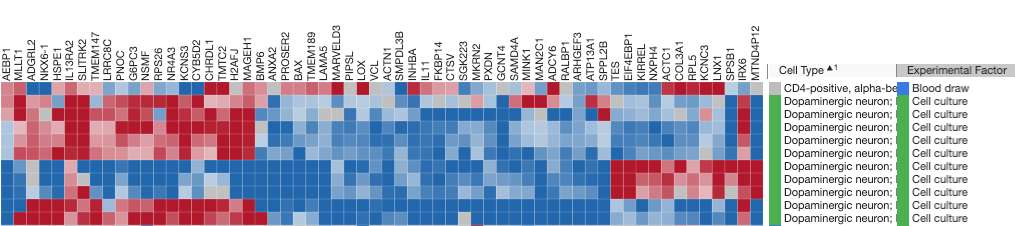
Figure 1: A heat map (from the Data4Cure Analysis Comparison App) showing expression levels of the top 100 differentially-expressed genes (DEGs) in 11 Parkinson’s disease studies. In this setting, the Analysis Comparison App enables searching for gene signatures across curated Parkinson’s datasets to reveal patterns of expression in related and diverse patient samples, mouse models and cell lines. Using the datasets within the Parkinson’s disease resource collection, the Data4Cure Biomedical Intelligence Cloud Platform reveals common up- and down-regulated genes in cell lines derived from Parkinson’s disease patients, across multiple datasets.
Similarly, markers revealed within Parkinson's disease such as those downregulated in familial PD patient samples, can lead to discovery of new biomarkers for PD (Figure 2).
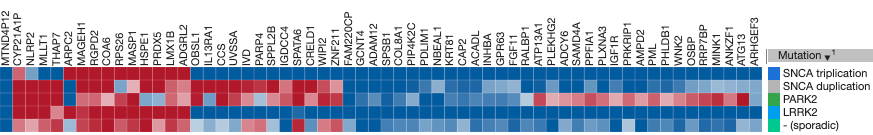
Figure 2: Using a gene signature derived from the top 60 DEGs from a meta-analysis of familial Parkinson’s disease patients versus healthy controls reveals a common pattern of differential expression in SNCA triplication, SNCA duplication, PARK2, LRRK2 and Sporadic models of PD. Each column indicates one gene and each row indicates one comparison. Red indicates up-regulation of the gene in that comparison and blue indicates down-regulation.
Moreover, advanced pathway analysis tools analyze your data in the context of a comprehensive set of signaling and metabolic pathways, offering insights into the most relevant pathways. This allows you to not only pinpoint the most significant pathways but also predict their activation or inhibition based on the gene expression patterns, facilitating a deeper understanding of the biological mechanisms at play within your PD dataset (Figure 3).
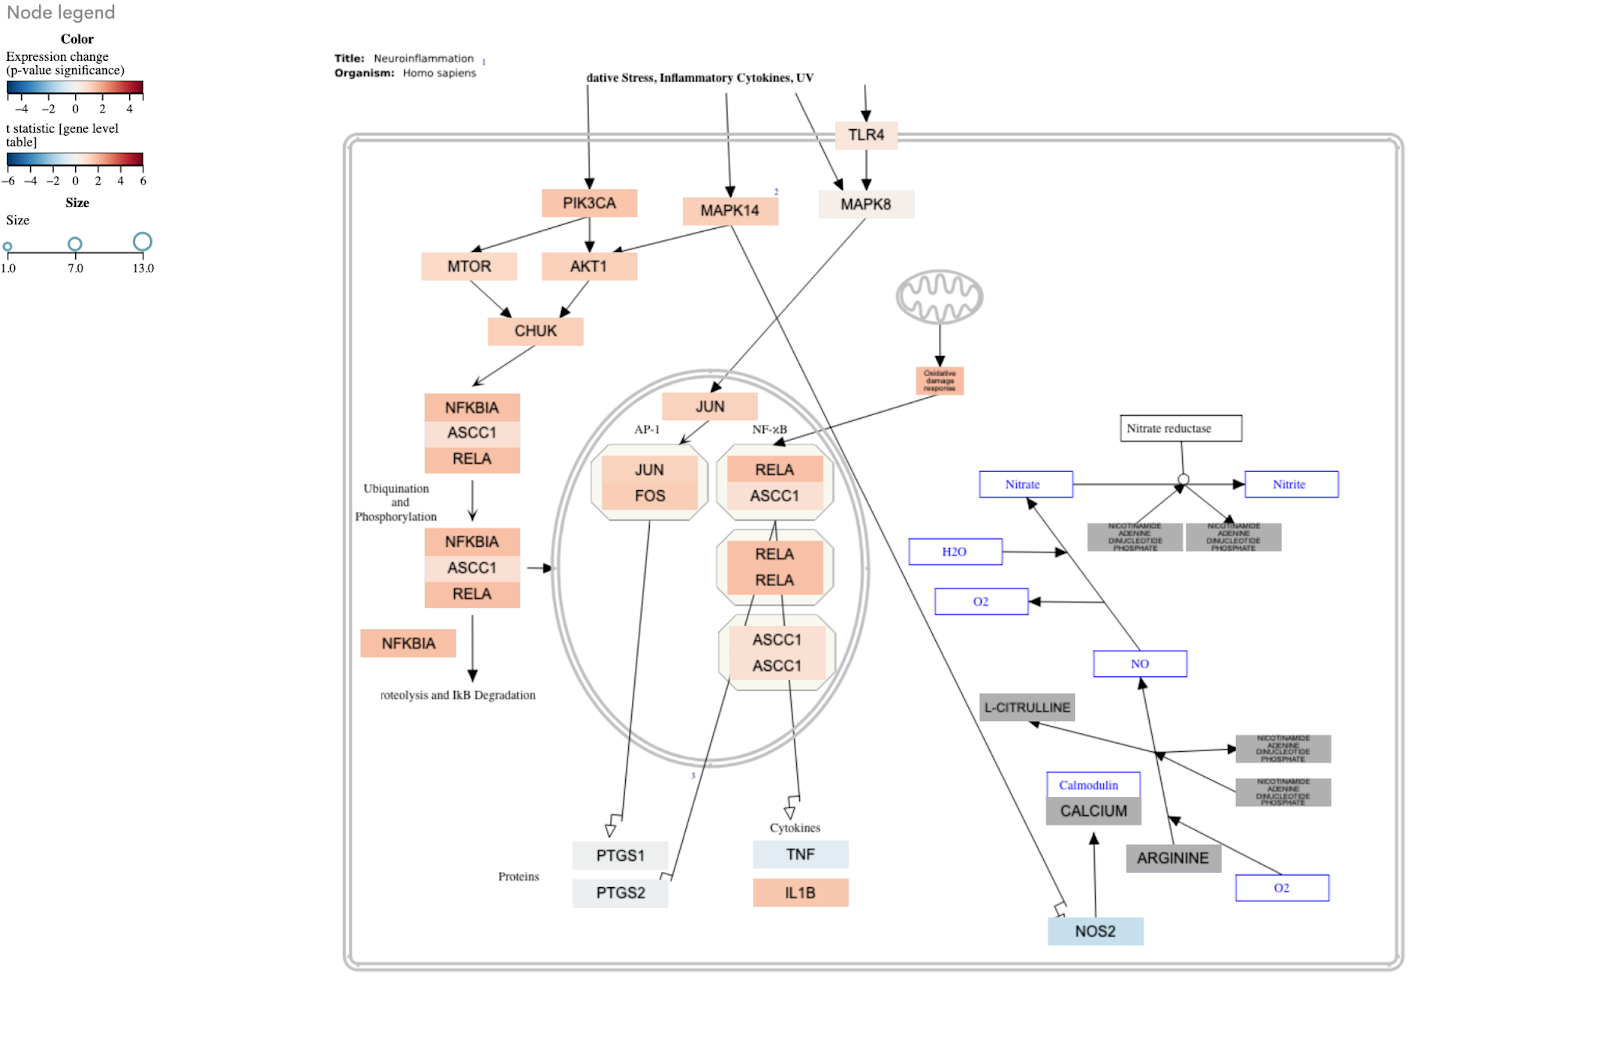
Figure 3: The neuroinflammation pathway shows activation in Parkinson’s disease patients compared to control subjects. Each box in the pathway diagram represents a gene, with red indicating up-regulation and blue indicating down-regulation. The network diagram illustrates the key genes involved in neuroinflammation signaling pathway and their interactions.
To analyze how your target gene is expressed in various neurological diseases like Alzheimer’s disease or Multiple Sclerosis, you can automatically pinpoint datasets with notable similarities and differences from a vast library of curated analyses (Figure 4). The Platform’s Differential Expression Explorer enables seamless comparison of gene expression results, thereby enhancing understanding of causal relationships between diseases and genes across various biological contexts. This unique capability empowers users to strengthen and validate existing hypotheses while also discovering new biological insights.
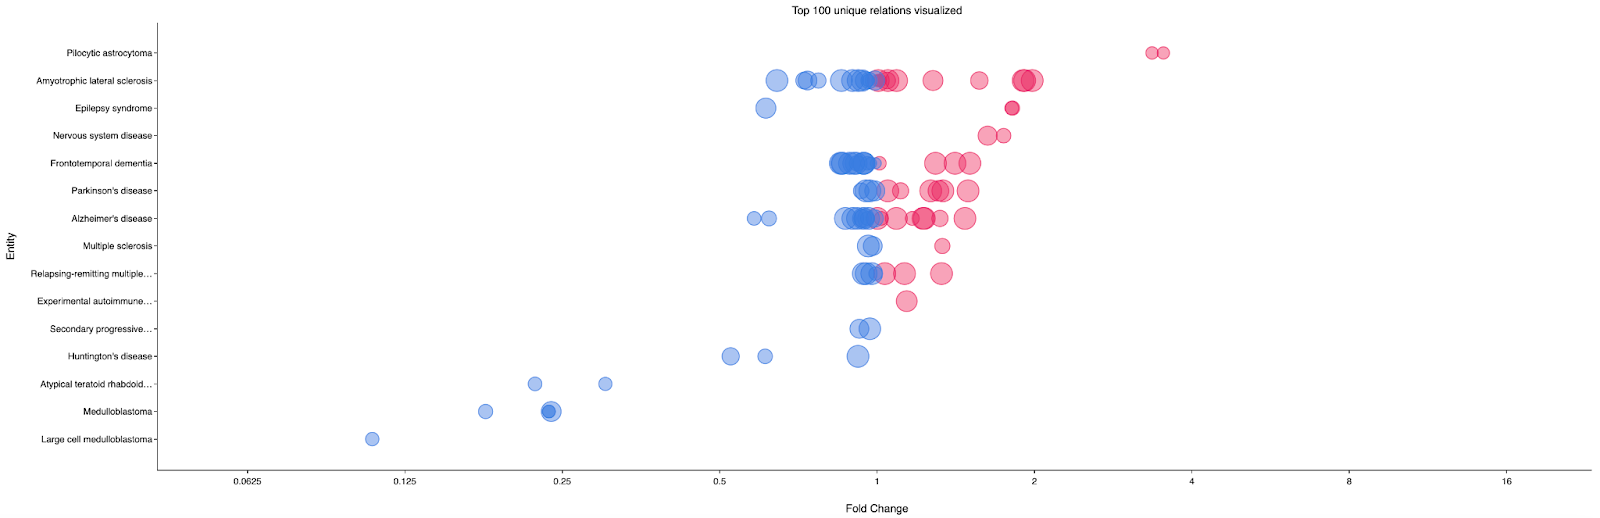
Figure 4: The Differential Expression Explorer bubble plot view reveals gene-relevant studies. The fold changes for LRRK2 expression between disease and control samples in different neurological diseases is plotted on the x-axis. Each row represents a different disease and each circle represents a single study for that disease. The size of the circle indicates the p-value (significance); larger circles are more significant.
Leveraging natural language processing to uncover literature associations with Parkinson’s disease.
In addition to analyzing gene expression patterns, the power of natural language processing (NLP) can be harnessed through the platform to delve deeper into the literature and verify associations between identified genes and Parkinson’s disease (Figure 5). This advanced capability, integrated within the platform, transcends simple keyword searches by enabling users to explore contextual relationships among various entities such as genes, diseases, drugs, pathways, and more. By leveraging NLP, you can gain a comprehensive understanding of the literature landscape surrounding Parkinson's disease, validating the relevance of identified genes and potentially uncovering novel insights into disease mechanisms and treatment avenues.
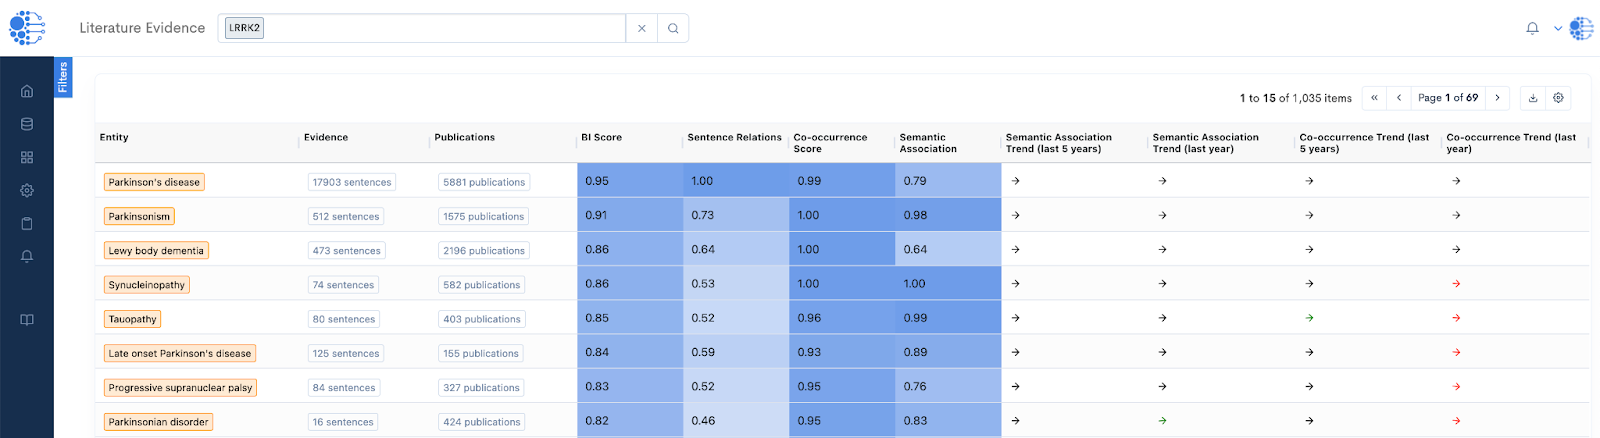
Figure 5: The Literature Evidence App reveals strong literature support for the association of LRRK2 with Parkinson’s disease.
The Biomedical Intelligence Cloud further computes the Biomedical Intelligence (BI) Score to rank associations between CURIE Knowledge Graph entities based on the available data and literature evidence.
Exploring Parkinson’s disease mechanisms at the single-cell level
Users can delve deeper into the disease mechanisms using the large collection of curated single-cell datasets available on the Platform. By leveraging such datasets for a complex disease such as Parkinson's, researchers can dissect the intricate cellular mechanisms underlying disease pathology at higher resolution. For instance, exploring single-cell gene expression profiles to distinguish oligodendrocyte subtypes within the substantia nigra, a brain region affected in Parkinson's, may reveal critical insights into dopaminergic neuron dysfunction and neuroinflammatory processes (Figure 6).
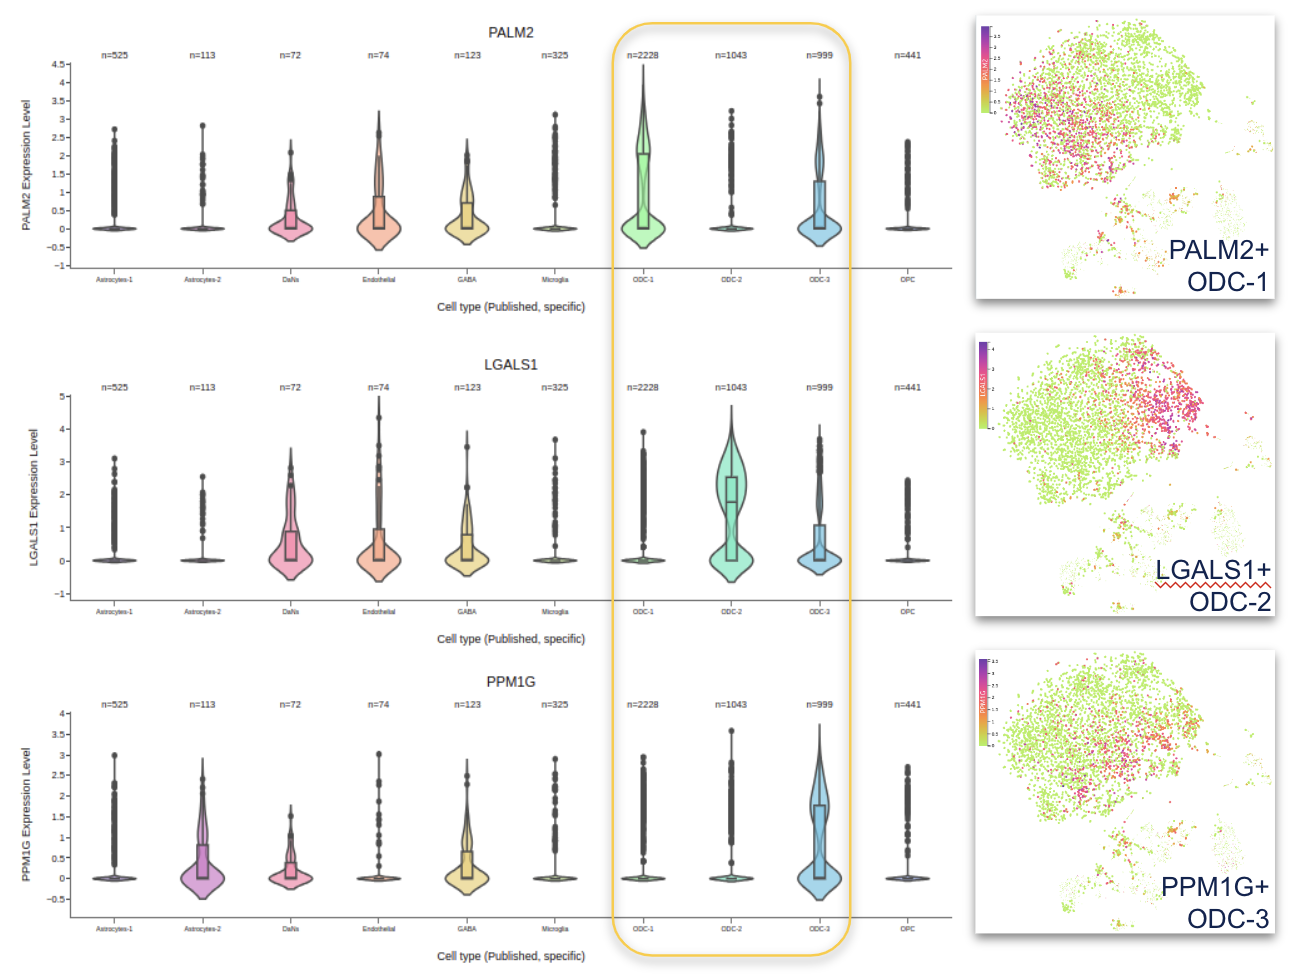
Figure 6: Single-cell RNA-seq reveals disease-associated oligodendrocyte subtypes (ODC). (Right Panel) UMAP plot showing three distinct subpopulations of oligodendrocytes in substantia nigra of Parkinson’s disease patient samples. (Left Panel) Violin plot showing the expression of marker genes PALM2, LGALS1 and PPM1G in different cell types in substantia nigra. The expression levels of the marker genes are indicated on the Y axis and different cell types are shown on the X axis.
Moreover, researchers can identify key molecular factors and potential therapeutic targets with enhanced precision by cross-referencing these single-cell datasets with comprehensive disease annotations and molecular pathways (Figure 7).
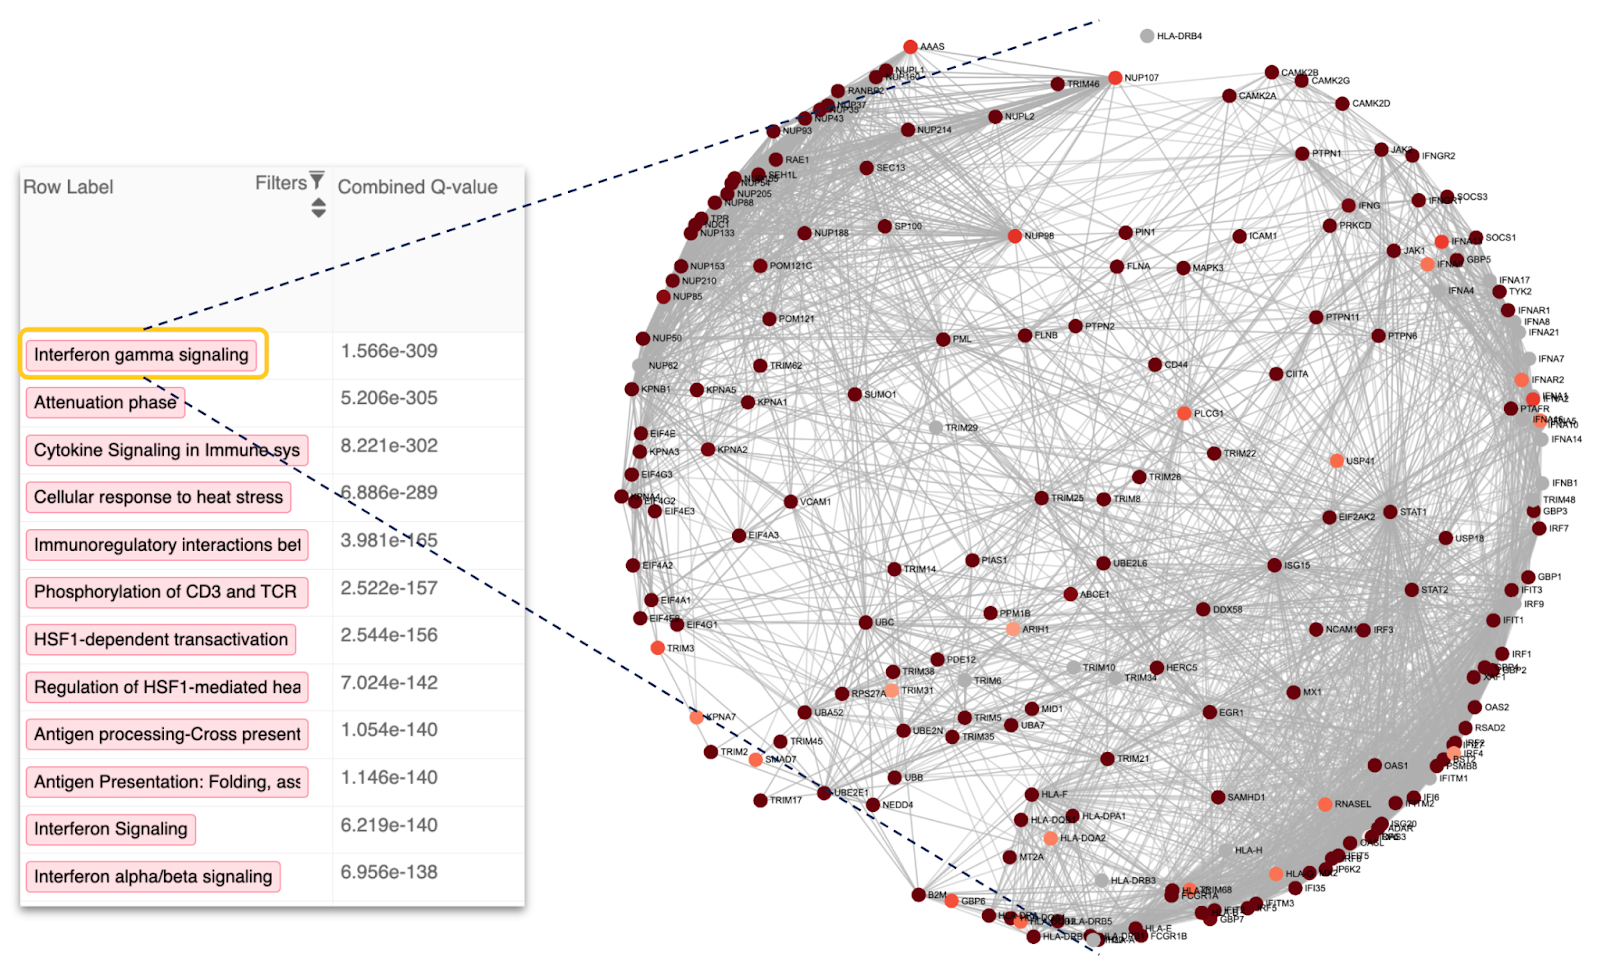
Figure 7: Uncover shared biological mechanisms among distinct brain tissues derived from four Parkinson’s disease-associated Single-cell RNA-seq datasets.
Omics studies frequently pursue similar hypotheses, yet they are performed using different platforms, under varying conditions, and with differing analysis methodologies. These factors, coupled with limited sample sizes, can lead to challenges in reproducibility and comparability. Achieving a comprehensive understanding and cohesive depiction of complex diseases remains a significant challenge, emphasizing the critical importance of integrating multiple omics studies effectively to unveil disease signatures.
The Data4Cure Biomedical Intelligence Cloud Platform takes a holistic approach to translational research, helping researchers extend beyond conventional data analysis to forge connections between thousands of datasets and additional sources of information, including biological networks and pathways, structured knowledge bases and literature. By integrating diverse data sources, the platform enables a comprehensive approach to knowledge generation, enabling new insights and accelerating the translation of research findings into clinical applications.
Now let’s turn data into cures.
We hope you found this article useful. As always, we’d love to hear from you. Write to us at info@data4cure.com. Let us know how we can help and let’s turn data into cures!
— The Data4Cure Team.